UNM graduate student salaries in 2011
As a grad student I often wondered how salaries varied across and within departments. As it turns out, student salary data exists for the curious. With a little digital elbow grease I was able to put together some comparisons.
As a publicly funded institution, the University of New Mexico is required to disclose its employees' salaries. Up until 2012, this data was only made available as a book on reserve in the library. UNM now has a portal website, though they do not provide student data. In January, 2011 someone decided to check out the UNM salary book, scan it to PDF and post it online. While searching for a colleague's webpage, I stumbled upon it. After some wrangling with the raw scan data, I plugged it in to my trusty Python console and started looking around.
You might first ask, why do we care about the salary data? Don't all grad students get paid the same thing? My understanding is that this is true for many universities (possibly the result of graduate employee unions??). UNM, however, doesn't work that way. UNM has a policy that goes something like this: teaching assistants (TA's) must be paid a minimum per FTE salary set by the university, as they are funded directly by the university; other graduate positions are paid per departmental policies. It gets more complicated in that departments can have very different policies. Some departments are like Computer Science, in which all graduates are paid the same, regardless of position or experience (more on this later). Other departments have some sort of pay schedule based on position and/or experience. And other departments are like Physics and Astronomy, which pays TA's according to the university guidelines, but allows professors or groups to decide how to pay grad students. What this all means is that grad student salaries vary widely.

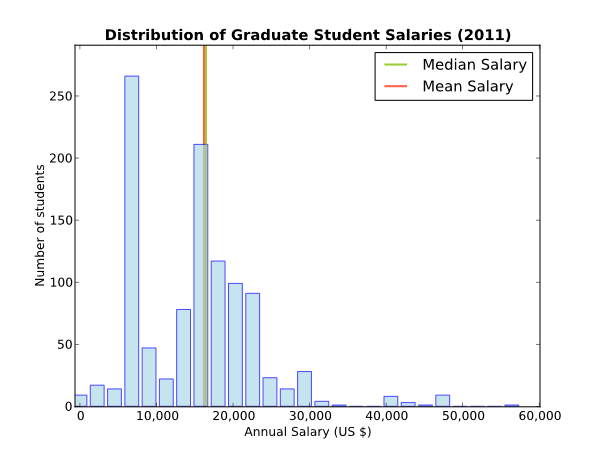
In the first plot you can see the distribution of all grad student salaries. I only counted five categories as (unambiguous) graduate positions: teaching assistant, teaching associate, graduate assistant (a.k.a. grading assistant), research assistant, and project assistant. There are some other categories, such as "student technical specialist", but it's unclear what portion of those are grad students versus undergrads. As you can see in the distribution of salaries, there is a somewhat underlying Gaussian distribution (i.e. bell curve), with some spikes at certain points. I'm going to guess that these are due to minimum and standard pay rates (the lower spike possibly being for half-time positions).

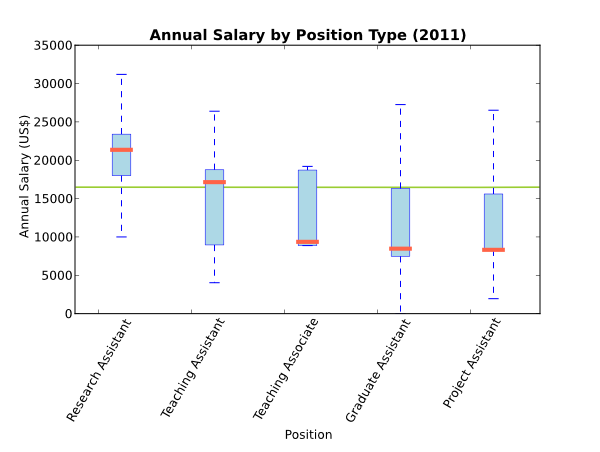
In the second plot we can see how different types of graduate positions compare. Only RA's and TA's have median salaries about the median salary for all graduate positions (the green line). The plot, by the way, shows box plots, with the red line marking the median salary, the blue box showing the range from 25th-75th percentile salaries, and the dashed lines extending to the maximum and minimum salaries (excluding outliers). It looks like you want to be an RA to make the big bucks, on average...
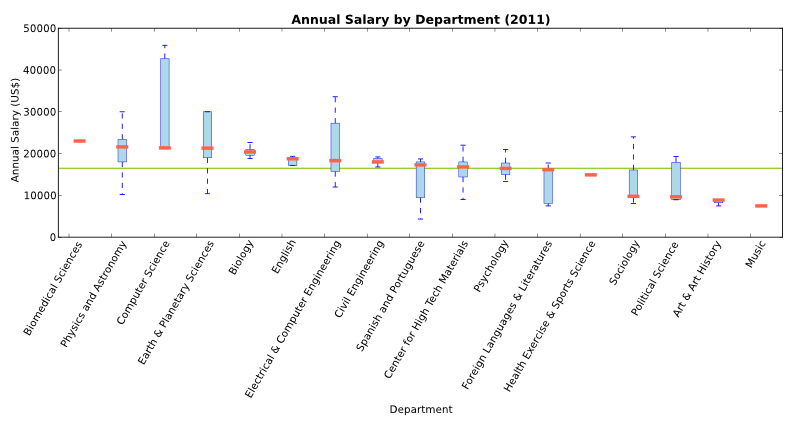
The third plot shows salaries for departments with more than twenty grad students on payroll. For these "large" departments, it seems that the median-above-median departments tend to be engaged in science and engineering (i.e. above the green line). Besides the variation in departmental salary medians, it's also interesting to see the difference in intradepartmental variation (e.g. Biomedical sciences versus Physics or ECE). Back to my original comment about the CS department having a fixed salary for everyone. The plot above seems to indicate otherwise. Well, if you look at the CS numbers, you see that everyone got paid one of two salaries: $21,360 or $42,720(!).
If you were curious like me, I hope I've given you a little more insight into the grad student compensation at UNM (at least from January 2011).
